
Quick answer
Key takeaways
- Track exceptions and trends instead of rewarding activity volume
- Pair each KPI with a threshold, accountable owner, and response rule
- Use one Supista Projects portfolio view backed by project-level evidence
Make the dashboard a decision system
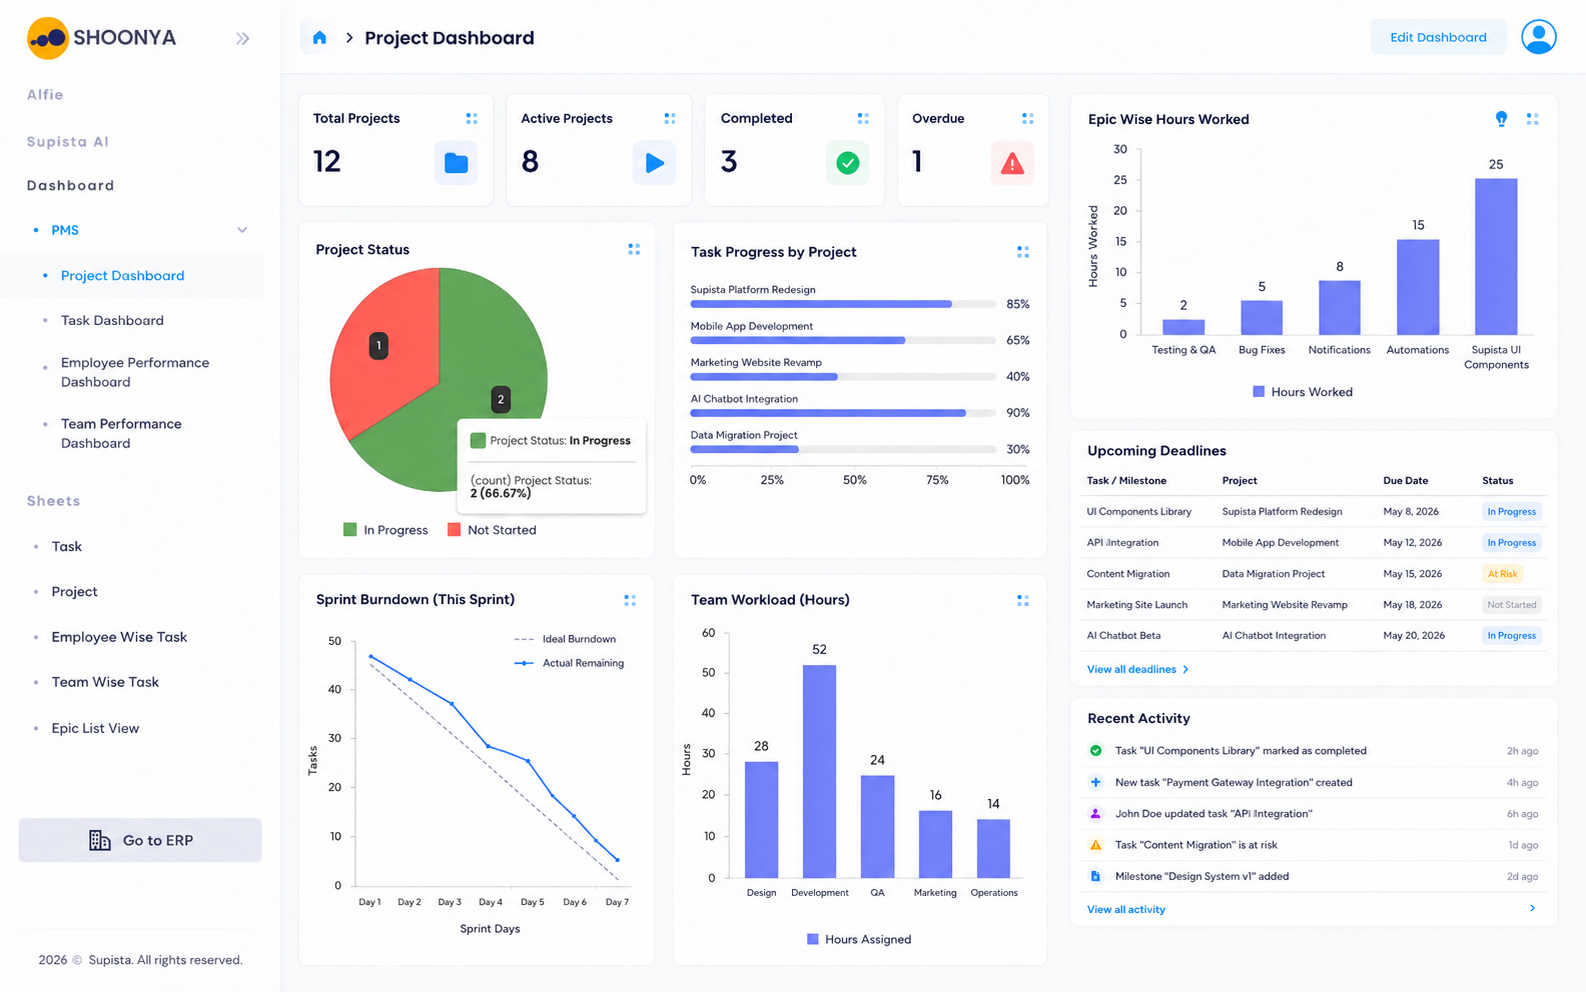
A Supista Projects portfolio dashboard should answer three questions quickly: what is off track, why does it matter, and who acts next. More charts do not create more control.
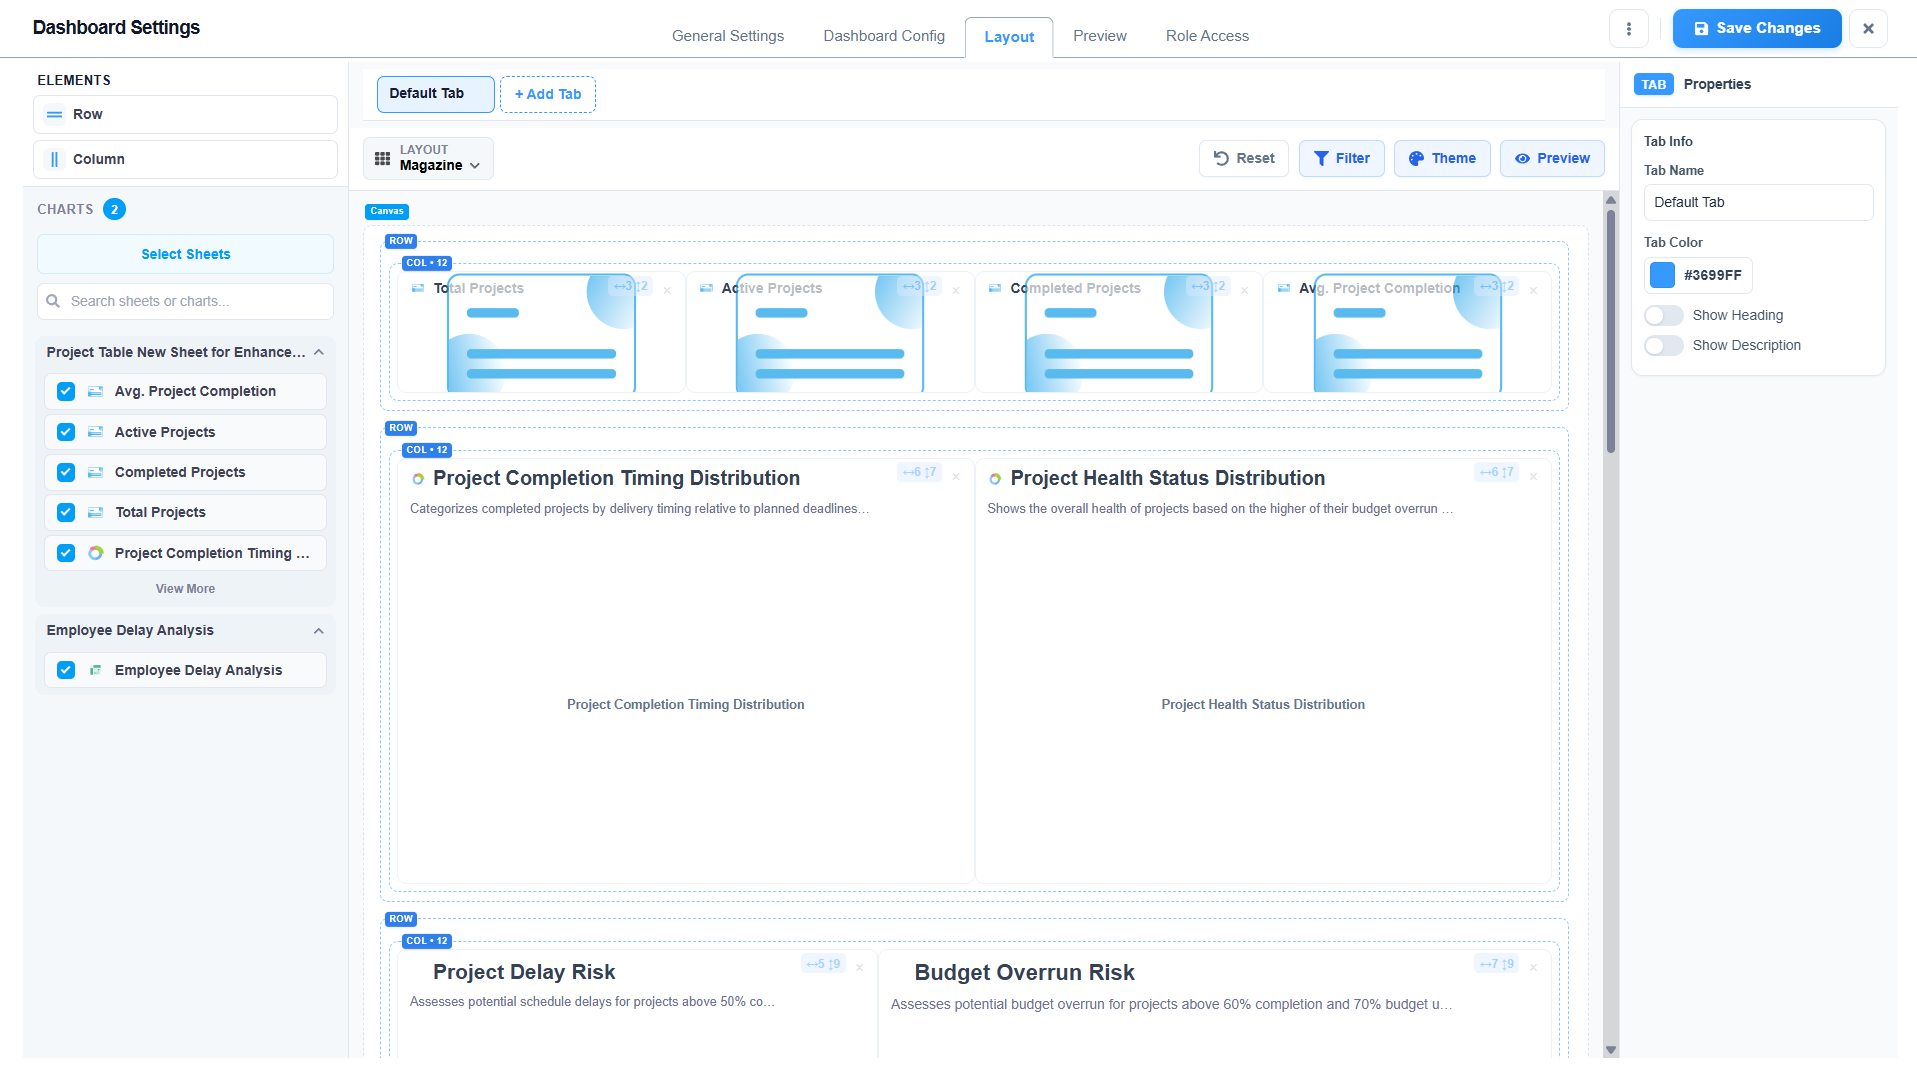
Give each metric a threshold and drill-down path. Leaders should move from a portfolio exception to the responsible project, milestone, task, cost, or approval without requesting another report.
Track these nine portfolio KPIs
These measures cover speed, financial control, capacity, predictability, and governance. Define each formula once so every team reads the same signal.
- On-time milestone rate — commitments completed by the approved date
- Schedule variance — difference between baseline and current forecast
- Budget variance — approved budget compared with actual spend
- Forecast accuracy — predicted completion compared with final completion
- Overdue task age — days open beyond the due date
- Blocked work duration — time waiting for a dependency or decision
- Capacity utilization — assigned effort compared with usable capacity
- Approval cycle time — time from submission to recorded decision
- Open high-impact risks — material exposures without a completed response
Read trends together, not in isolation
High utilization can look efficient while overdue work grows. A stable budget can hide schedule exposure when a critical approval remains blocked. Read related signals together before changing a commitment.
Use weekly trends for operational decisions and monthly trends for portfolio choices. Supista Projects preserves the project detail beneath each KPI, helping leaders challenge the signal without rebuilding it in slides.
Build a simple review rhythm
Let the live Supista Projects dashboard drive the meeting. Review material exceptions first, confirm the owner and next action, then record the decision beside the underlying work.
- Review critical exceptions weekly
- Record decisions beside the underlying work
- Assign a date to every recovery action
- Retire metrics that never change decisions
- Review thresholds every quarter
Clear answers
Frequently asked questions
How many KPIs should a project dashboard include?
A leadership view usually needs six to ten decision-oriented KPIs. Detailed operational measures should remain available through drill-downs.
What is the most important project portfolio KPI?
On-time milestone rate is a strong starting point, but it should be reviewed with schedule variance, blocked work, and forecast accuracy to explain future risk.
Put the guide into practice
Control delivery without adding reporting work
Connect plans, owners, approvals, budgets, workloads, and risks in Supista Projects.