
Every function brings a version
Planning, procurement, site and finance use different cut-off dates and structures. The meeting debates numbers before reaching the project issue.
EPC project analytics and dashboards
Built for CEOs, project directors and functional leaders. Compare portfolio and project health, then drill from a schedule, cost, procurement, material or billing signal to the permitted source record.
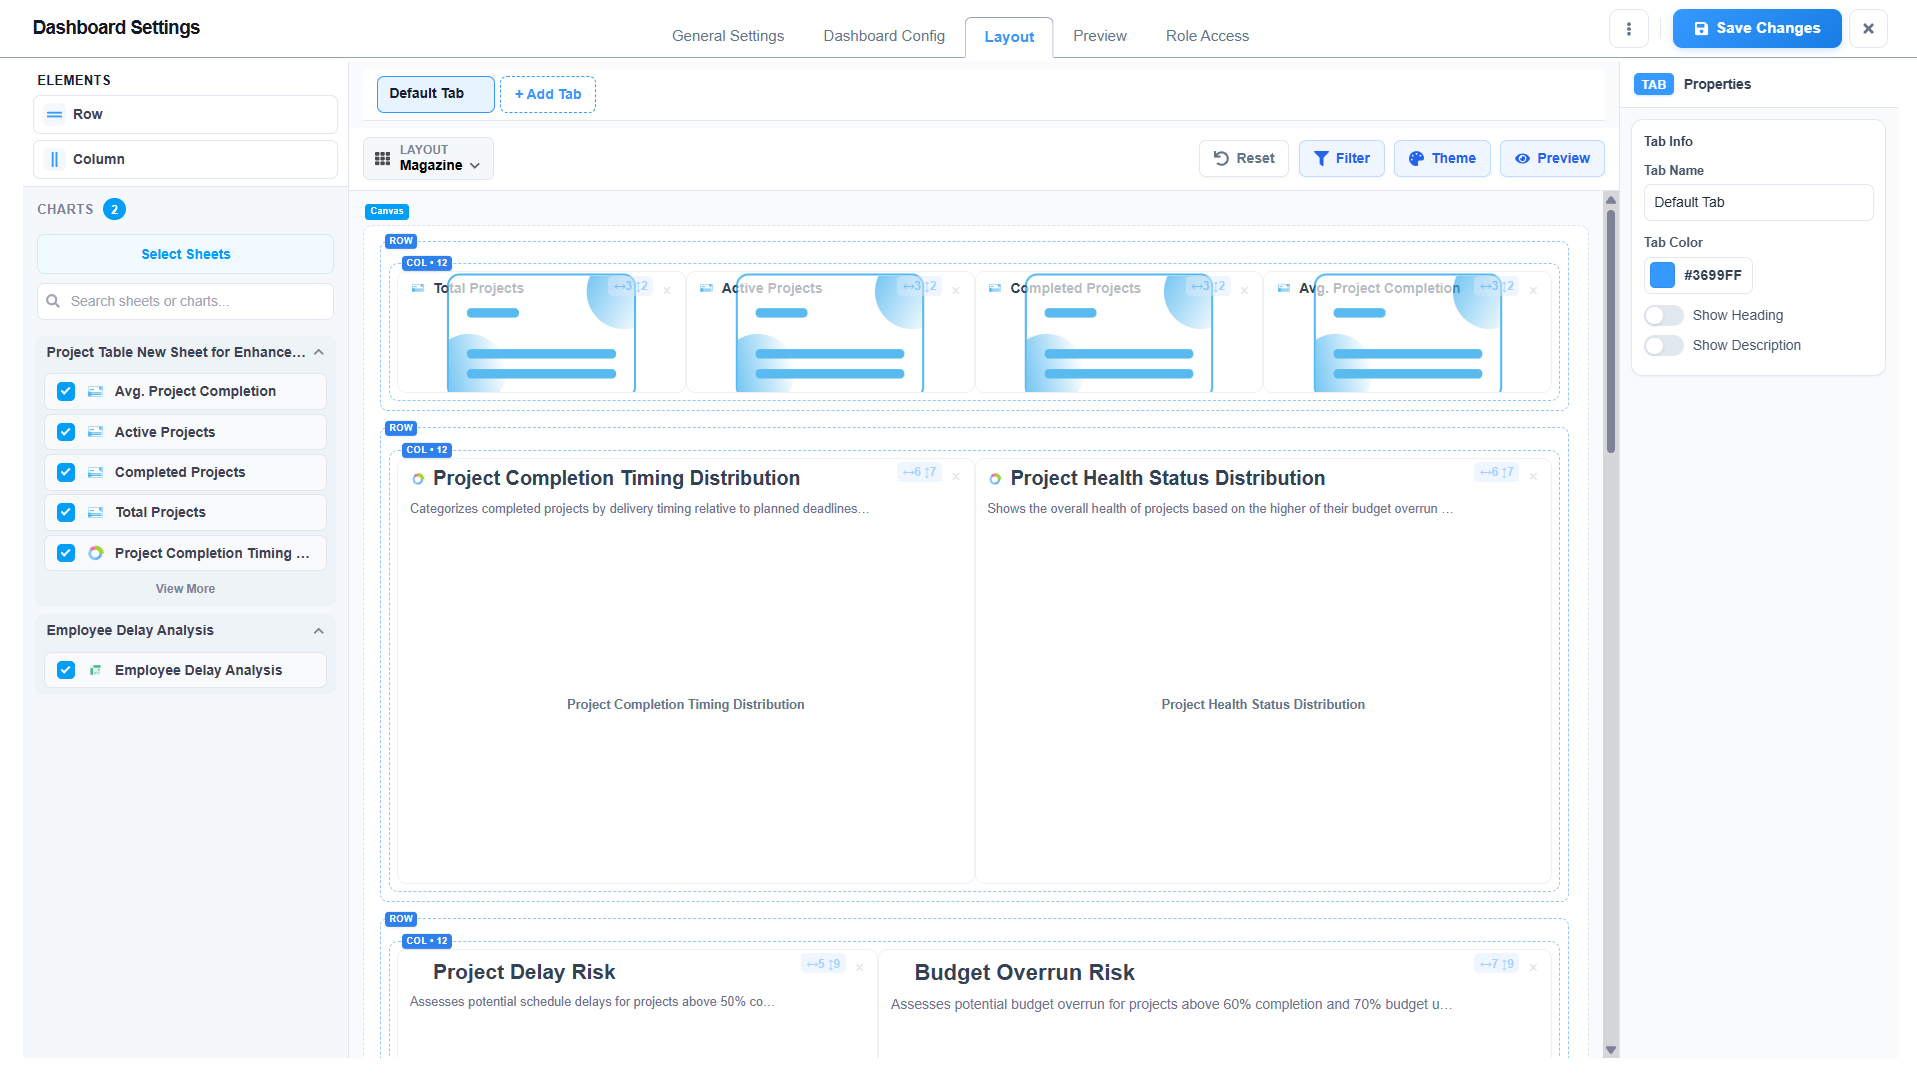
What is epc project analytics and dashboards? EPC project analytics and dashboards combine approved operational records into role-based portfolio and project views. Leaders can review schedule variance, budget and cost exposure, procurement status, material availability, missing DPRs, blockers, billing and collections, then trace an exception to its source instead of relying on disconnected presentations.
The operational problem
Planning, procurement, site and finance use different cut-off dates and structures. The meeting debates numbers before reaching the project issue.
Overall progress appears acceptable while one work package lacks material or exceeds budget. Leaders need exceptions, not another high-level percentage.
A red KPI cannot open the delayed PO, missing DPR or unpaid invoice behind it. Teams leave the review with more reconciliation work.
Connected EPC records
Analytics becomes actionable when WBS, cost, purchase, material, DPR, blocker and billing records retain shared project dimensions. Role views can then answer different questions while drawing from governed source records.
Core capabilities
Compare active projects using consistent configured measures. Direct executive attention to material exceptions rather than report preparation.
Review baseline and actual progress signals with delay context. Open the affected project or activity for investigation.
Compare budget, commitments and recorded actuals by project or package. Trace variance to available source transactions.
See requisitions, sourcing, orders and pending delivery positions. Identify purchases threatening required-at-site dates.
Relate location stock and pending receipts to current project demand. Surface shortages requiring operational confirmation.
Show missing DPRs, open blockers and pending actions. Make data gaps visible instead of hiding them in the dashboard.
Configure dimensions, filters and role views for the agreed review process. Preserve permission controls on underlying records.
Product walkthrough
Role dashboards present relevant exceptions and preserve drill-down to the permitted records behind each measure.
Operational takeawayThe view gives authorised teams a shared record for the next decision; it does not replace physical verification or professional judgement.
Feature workflow
Role-based value
Compare project health, cash exposure and the exceptions requiring executive intervention.
Review schedule, blockers, DPR compliance and material readiness for one project.
Track budget exposure, billing readiness, due invoices and collections.
See sourcing queues, pending orders, late receipts and vendor follow-up.
Lois AI in this workflow
Lois works with permitted Supista data and does not bypass configured validations, permissions or approvals.
“Show the five largest risks across active projects.”
“Why did Project B move to amber?”
“Prepare tomorrow’s portfolio review.”
Connected EPC lifecycle
Proof and deployment confidence
Configure measures, dimensions, filters and access with process owners before rollout. Dashboards display available records and should expose data gaps; they do not convert incomplete inputs into verified business facts.
Buyer questions
They combine project, schedule, cost, procurement, material, site-reporting and billing records into role-based views with source drill-down.
A CEO view should focus on portfolio health, major schedule and cost exposure, cash position and issues needing executive intervention rather than operational detail.
Where the source is connected and the user has permission, dashboard exceptions can link to the relevant activity, transaction, material record, DPR or bill.
Yes. Configurable role views can present the measures and filters relevant to project, procurement, commercial, finance and executive responsibilities.
Not automatically. Dashboards show available records and configured calculations. Qualified users remain responsible for forecast assumptions and management interpretation.
Lois can summarise permitted records and explain available context. Users must review the answer, and permissions, validations and approvals remain in place.
Use a real workflow
Bring your current management report or review agenda. We’ll show how each exception can connect to an owner and the record behind it.
Book a free strategy session with our Automation Experts and discover how Supista’s AI-Composable ERP can transform your operations into a scalable and intelligent system.